Teaching material · Behnam Mo
AI Errors and Hallucinations
Understand why plausible answers fail, read factuality benchmarks carefully, and decide when an answer should give way to a question or referral.
Hallucination and reliability
Fluency is observable. Truth needs a reference.
A hallucination is a plausible-looking claim that is unsupported or false in the relevant context. It can be an invented policy, a nonexistent citation, or a confident answer to a question the system cannot know.
We should distinguish falsehood from disagreement, and a missing answer from a fabricated one. “This item qualifies” contradicts the fictional Northstar policy, which excludes final-sale items. “Staff must review it” can be correct when the policy leaves something unresolved. A refusal to answer every question would avoid many false claims while making a useless support service. Reliability therefore requires measuring both errors and useful coverage.
The argument that errors compound
Yann LeCun has argued that generating a long answer one token at a time creates an accumulating risk of leaving the space of correct answers. A token is a unit of text, often a word fragment. In a simplified process with the same conditional departure risk at each step and no recovery, the chance of never departing is:
P(no departure) = (1 − ε)n
Here, ε is the assumed departure probability at each step, and n is the number of steps. At a 1% risk for 100 steps, the result is about 36.6%. At a 0.1% risk, it is about 90.5%. Constant conditional risk is sufficient for this product; unconditional independence is not a necessary assumption. The calculation is correct under its assumptions. Whether those assumptions describe a particular language-model system is the substantive question. LeCun’s explanation.
Explore the assumption
This is a hypothetical process, not measured model performance.
Chance of no departure:
The argument warns us against treating a long, unchecked answer as automatically dependable. It does not establish that useful coding or factual work is impossible. There can be many correct continuations; risk depends on the context; a draft can be revised; and an application can check claims against documents or executable tests. These interventions change the process being evaluated. A successful coding system challenges a sweeping prediction of uselessness; it does not prove that every factual answer is reliable.
Formal impossibility results also have boundaries. Kalai and Vempala study calibrated models and arbitrary facts that cannot be inferred from finite training data. Xu and colleagues show limits on universal correctness across constructed tasks. Neither result gives the error rate of our narrow return-policy bot. The business question is how often our system fails, in which situations, and with what consequence.
Read the benchmark before reading the ranking
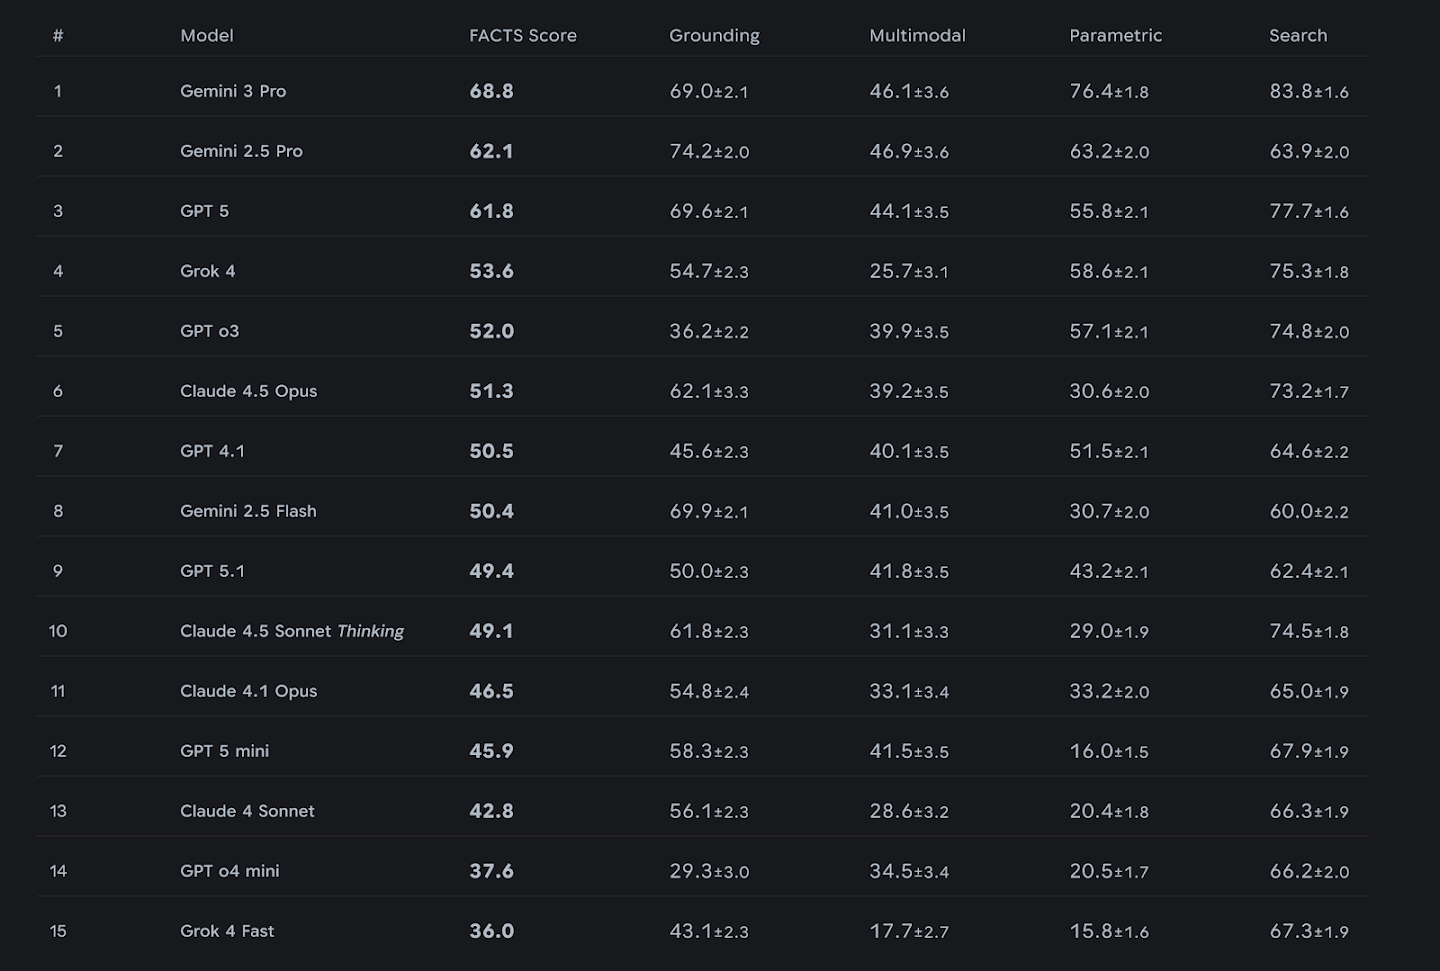
Google’s December 2025 comparison reported 54.5% for Gemini 2.5 Pro and 72.1% for Gemini 3 Pro on SimpleQA Verified, a short factual-answer benchmark. That is a substantial improvement on the same test. It is provider-reported, dated evidence; it is not a current leaderboard or a guarantee about customer-service policy compliance. The broader FACTS suite deliberately tests different settings, including grounding, search, and images. Google’s benchmark report.
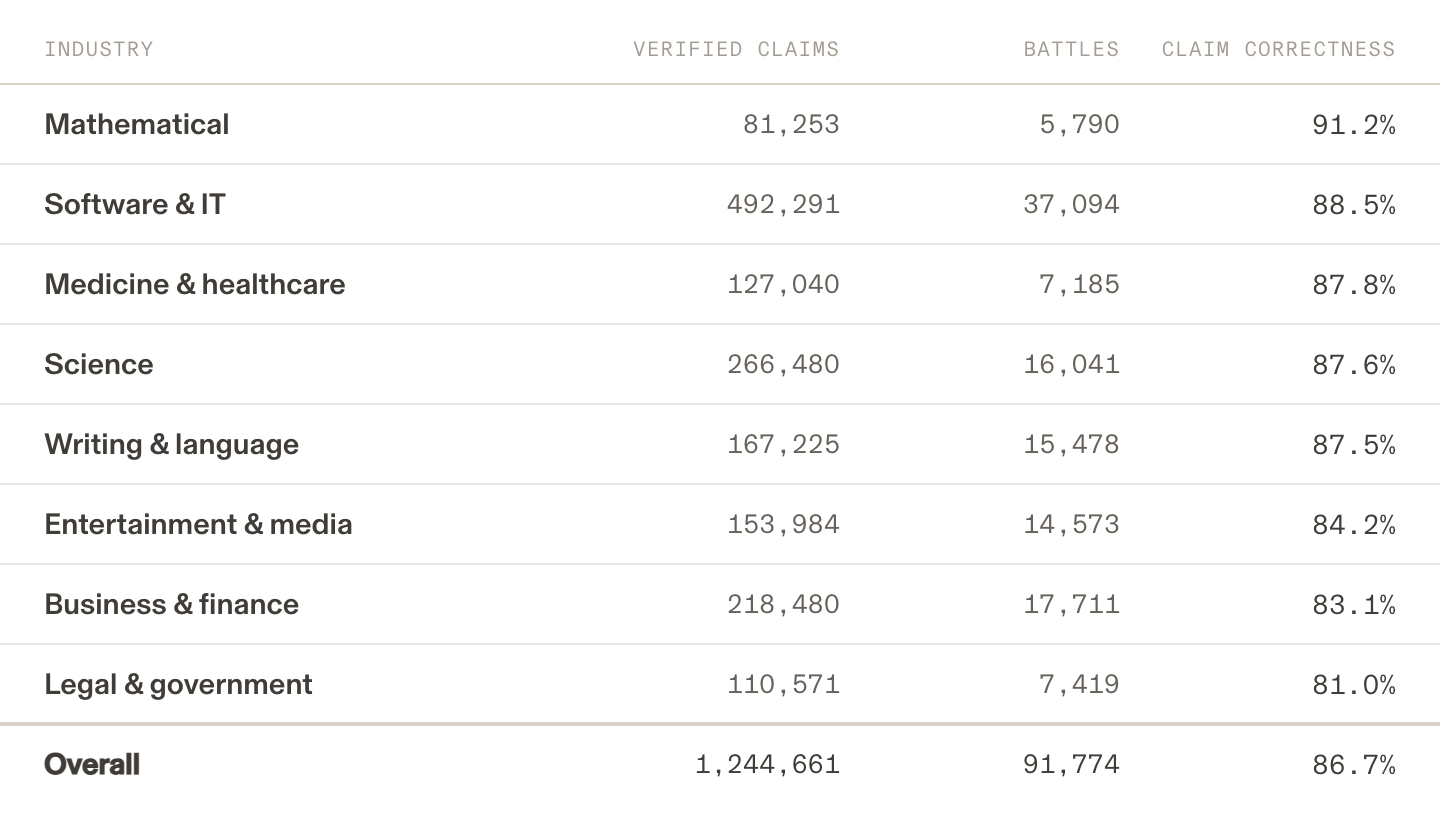
Arena’s July 2026 analysis reported aggregate true-claim rates of about 87% in Text Arena and 89% in Search Arena. Responses averaged roughly five and ten claims respectively. These are claim-level results from automated verification, with different question populations; the two-point difference does not isolate the causal benefit of search. One incorrect claim can undermine an otherwise accurate response. Its composite leaderboard also includes human preference. Arena’s methods and results.
Choose the service, then defend the choice
These are invented results for 100 questions, included to expose the tradeoff.
| System | Correct | Wrong | Declined | Correct among answered |
|---|---|---|---|---|
| A | 80 | 20 | 0 | 80% |
| B | 70 | 5 | 25 | 93.3% |
System B answers fewer questions correctly overall but makes far fewer false claims. Would your decision change if a wrong answer created a refund obligation? What if staff could not handle 25 referrals? Report coverage, error, and referral cost together. There is no business objective called “make one benchmark number large.”
Evidence from practice
When an incorrect answer reaches a customer
Air Canada: a company can be liable for chatbot misinformation
In February 2024, the British Columbia Civil Resolution Tribunal decided Moffatt v. Air Canada. After a passenger’s grandmother died, Air Canada’s chatbot told him he could buy a regular fare and seek a bereavement refund within 90 days. The airline later refused, pointing to a policy that required the request before travel. The tribunal held Air Canada liable for the chatbot’s misleading information and awarded the passenger the fare difference and related amounts.
The documented consequence is a legal ruling and a modest monetary award, not proof that every chatbot answer binds a company. The managerial failure was simpler: the airline put an authoritative-seeming agent in a transaction path without ensuring that its answer matched the policy. A disclaimer elsewhere on a website did not cure a contradictory answer from the company’s own tool.
Takeaway: Treat an AI answer about price, eligibility, refunds, or deadlines as customer-facing policy. Give it a controlled source, test it against the policy, and provide a human escalation path. Discuss: Which answers should a service bot be unable to give without retrieving an approved policy record?
Google AI Overviews: scale exposes the queries nobody tested
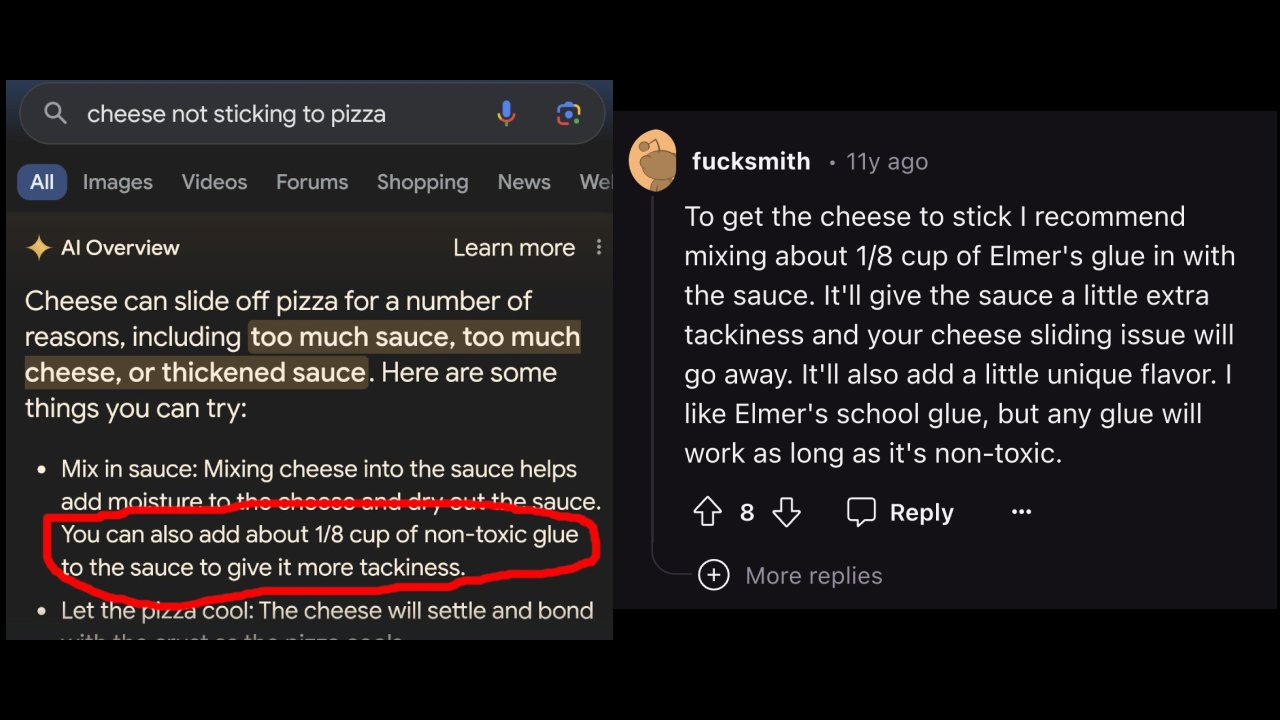
After Google expanded AI Overviews in the United States in May 2024, users circulated odd, inaccurate, and unhelpful results. In its May 30 update, Google acknowledged that some examples were fabricated but also said real failures had appeared. It identified problems with nonsensical queries, satire, user-generated content, and limited high-quality information, then described more than a dozen changes.
The documented consequence is product remediation. The post does not establish that every widely shared screenshot was real, nor does it quantify consumer harm from each answer. Its stronger lesson is operational: pre-release tests, red-teaming, and samples of typical traffic did not cover the full distribution of millions of live queries. Edge cases became ordinary exposure at search scale.
Takeaway: Evaluate the system people will actually use, including adversarial, ambiguous, satirical, and low-information queries. Measure both answer quality and whether the system should answer at all. Discuss: For which query categories should a product abstain instead of generating a polished answer?
New York City MyCity: feedback needs its denominator
A December 2025 New York City Comptroller audit found inconsistent and inaccurate responses from the MyCity chatbot. Of 70 people who submitted thumbs-up or thumbs-down feedback in July and August 2025, 50, or 71.4%, submitted negative feedback. The audit also found that wording and capitalization could change the answer to the same basic question.
That 71.4% describes feedback submitters, not all users or all questions. More than 2,200 questions were asked during the period, and people who choose to respond may be unusually dissatisfied. The audit nevertheless documented failures through independent testing and criticized the agency’s competing denominator, which treated nonresponse as satisfaction. A dashboard can be mathematically neat and still conceptually dishonest.
Takeaway: Report the numerator, denominator, response rate, sampling process, and unresolved cases. Pair feedback with task-based testing. Discuss: What metric would you publish beside a satisfaction rate so that a decision-maker cannot mistake it for population-wide sentiment?